Everything you need to write about fuel prices using our data: the figures, where they come from, what we can say on the record, and the exact credit line to use.
You can quote our figures in reporting with attribution. Reusing the underlying data — downloading it, republishing tables, building products on it — follows each source’s own terms, which the sources page lists; some sources are withheld from our exports until their terms are reviewed. The numbers below are generated from the live dataset every time this page is built.
FuelWide's Rochester, NY metro average for Thursday 17 September 2026 was $4.375 (AAA daily metro data). Cited us? Tell us through the contact page and we will list it.
Stories in this week’s data
Automated calculations from the dataset for the week of 2026-10-05, rebuilt every refresh. Each lead states its scope, period and source, and links to the page that shows the working — check that page before publishing.
US this week
US regular gasoline averaged $4.35 a gallon in the week of 2026-10-05, down 2.5% on the week; a 15-gallon fill costs $65.31.
The national number most readers compare against. The US weekly brief breaks it down by state, metro and commute cost, with downloadable charts.
Basis: U.S. Energy Information Administration weekly retail survey, week of 2026-10-05. Fill cost: FuelWide calculation.
Petrol costs €1.27 more per litre in Denmark than in Malta — €63.25 on a 50-litre tank, across 42 European markets priced in the week of 2026-10-05.
The widest national-average gap among the European markets we track, which makes a European fuel-price story concrete rather than directional. National averages hide station-level variation inside each country.
Basis: 42 European national averages, week of 2026-10-05. Sources: European Commission Weekly Oil Bulletin (EU-27) plus national publishers for non-EU markets. Calculation: FuelWide.
Petrol in Finland rose 1.7% since 2026-09-28, the steepest increase of any European market, to €2.37 a litre.
The Commission publishes each country's weekly price level; the week-on-week change here is our calculation from consecutive bulletins, so it can be checked against the Commission's own historical files.
Basis: Change between two dated national averages (2026-09-28 → 2026-10-05). Source: European Commission Weekly Oil Bulletin or the market's national publisher. Calculation: FuelWide.
Petrol in Poland fell 18.0% since 2026-09-28, the largest drop in Europe, to €1.52 a litre.
The counterpart to the rise, and the half of the story that goes unreported in weeks when the headline is upward.
Basis: Change between two dated national averages (2026-09-28 → 2026-10-05). Source: European Commission Weekly Oil Bulletin or the market's national publisher. Calculation: FuelWide.
A driver crossing from Finland into Sweden saves €0.78 a litre — €39.05 on a 50-litre tank, the widest of any European land border. 86% of that gap is duty and VAT rather than fuel.
Fuel tourism is a recurring local story on both sides of a border. The tax part of a gap tends to persist, because excise changes by legislation rather than weekly with crude; the rest moves with margins and wholesale prices.
Basis: National averages, week of 2026-10-05, not prices at the nearest stations to the crossing; the saving ignores the extra driving. Source: European Commission Weekly Oil Bulletin / national publishers. Calculation: FuelWide.
Duty and VAT are 56.3% of the pump price of petrol in Malta and 30.4% in Poland, in the week of 2026-10-05.
Across the 28 markets that report a usable pre-tax price, tax per litre varies by €0.81 and the pre-tax price by €0.78. Tax is the larger measured part of the spread, but pre-tax prices — distribution, margins, competition — differ too.
Basis: Pump and pre-tax prices as reported by member states to the European Commission Weekly Oil Bulletin, week of 2026-10-05. Markets whose pre-tax figure fails our plausibility check are excluded. Calculation: FuelWide.
Source: FuelWide calculation (fuelwide.com) from national pump-price data for the week of 2026-10-05; credit the underlying publisher named on the linked page (for EU markets, the European Commission Weekly Oil Bulletin).
What a fixed amount of fuel costs in Canada, California, Ohio and Delaware. Each calculation below uses the same figures as its linked page. Reference periods differ: Canadian observations are monthly; AAA state comparisons are daily. Check the dated source before publishing.
Canada · 2026-08
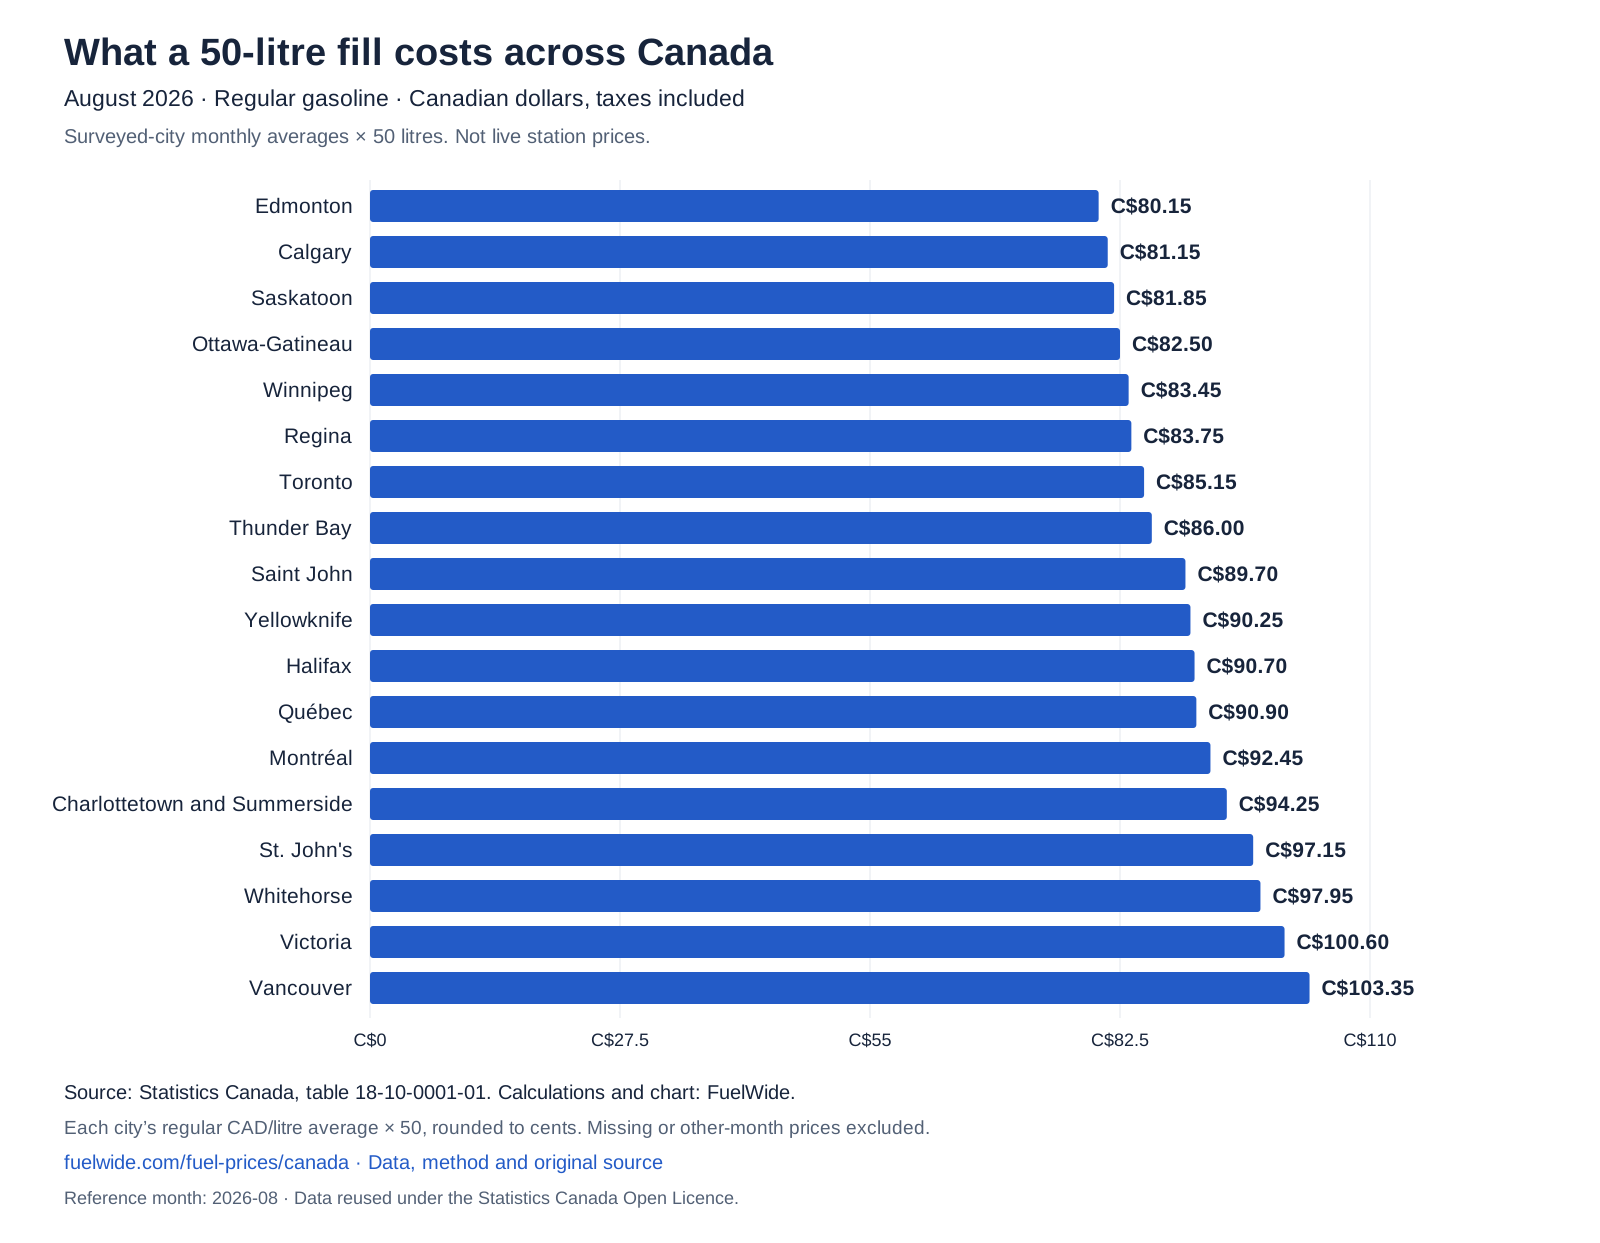
A 50-litre regular-gas fill ranged from C$80.15 in Edmonton to C$103.35 in Vancouver, a C$23.20 difference, across 18 surveyed Canadian cities in August 2026.
FuelWide multiplies Statistics Canada's monthly regular-gas city averages by 50 litres and rounds to cents. These are surveyed-city averages, not individual stations, provincial averages or live prices. The national figure is Statistics Canada's separate published series, not the mean of these cities.
A 50-litre regular-gas fill ranged from C$80.15 in Edmonton to C$103.35 in Vancouver, a C$23.20 difference, across 18 surveyed Canadian cities in August 2026.

Source: FuelWide calculation from Statistics Canada, table 18-10-0001-01; reference period 2026-08. https://fuelwide.com/fuel-prices/canada#fill-cost
Original source: https://www150.statcan.gc.ca/t1/tbl1/en/tv.action?pid=1810000101
A 15-US-gallon fill of regular gasoline in California costs about $94.73 at the state average reported on 2026-10-10, $1.18 less than on 2026-10-03.
FuelWide multiplies each AAA regular state average by 15 US gallons, rounds each bill to cents and subtracts the earlier bill. Same fuel and quantity in both periods; individual station prices vary. This measures a price change, not its cause.
A 15-US-gallon fill of regular gasoline in California costs about $94.73 at the state average reported on 2026-10-10, $1.18 less than on 2026-10-03.

Source: FuelWide calculation from AAA daily state averages; reference period 2026-10-10. https://fuelwide.com/gas-prices/usa/california#moves
Original source: https://gasprices.aaa.com/?state=CA
Ohio · 2026-10-10
A 15-US-gallon fill of regular gasoline in Ohio costs about $58.61 at the state average reported on 2026-10-10, $2.58 less than on 2026-10-03.
FuelWide multiplies each AAA regular state average by 15 US gallons, rounds each bill to cents and subtracts the earlier bill. Same fuel and quantity in both periods; individual station prices vary. This measures a price change, not its cause.
A 15-US-gallon fill of regular gasoline in Ohio costs about $58.61 at the state average reported on 2026-10-10, $2.58 less than on 2026-10-03.

Source: FuelWide calculation from AAA daily state averages; reference period 2026-10-10. https://fuelwide.com/gas-prices/usa/ohio#moves
Original source: https://gasprices.aaa.com/?state=OH
Delaware · 2026-10-10
A 15-US-gallon fill of regular gasoline in Delaware costs about $63.65 at the state average reported on 2026-10-10, $0.28 less than on 2026-10-03.
FuelWide multiplies each AAA regular state average by 15 US gallons, rounds each bill to cents and subtracts the earlier bill. Same fuel and quantity in both periods; individual station prices vary. This measures a price change, not its cause.
A 15-US-gallon fill of regular gasoline in Delaware costs about $63.65 at the state average reported on 2026-10-10, $0.28 less than on 2026-10-03.

Source: FuelWide calculation from AAA daily state averages; reference period 2026-10-10. https://fuelwide.com/gas-prices/usa/delaware#moves
Original source: https://gasprices.aaa.com/?state=DE
For questions about these calculations or corrections, contact FuelWide. The figures describe observed differences; they do not establish what caused a price change.
Charts you can publish
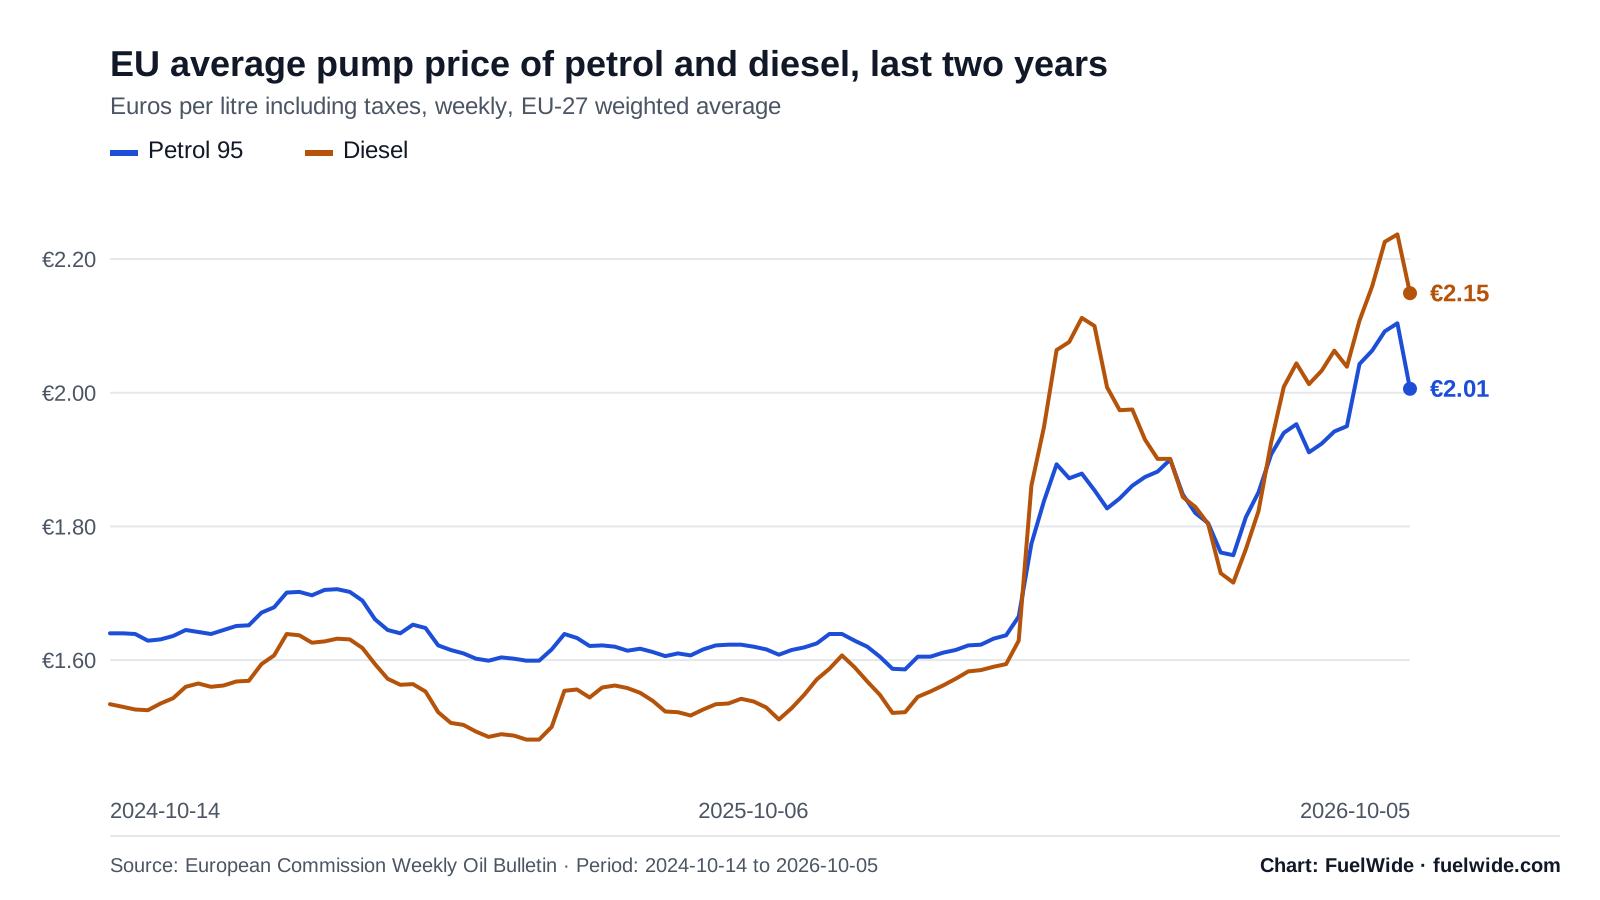
Light-background charts, 1600×900, with the source, period and credit printed on them. Download SVG or PDF here; PNG from the chart’s own page. Rebuilt with every data refresh — the file name carries the latest date. EIA and European Commission data only, both free to republish with credit.
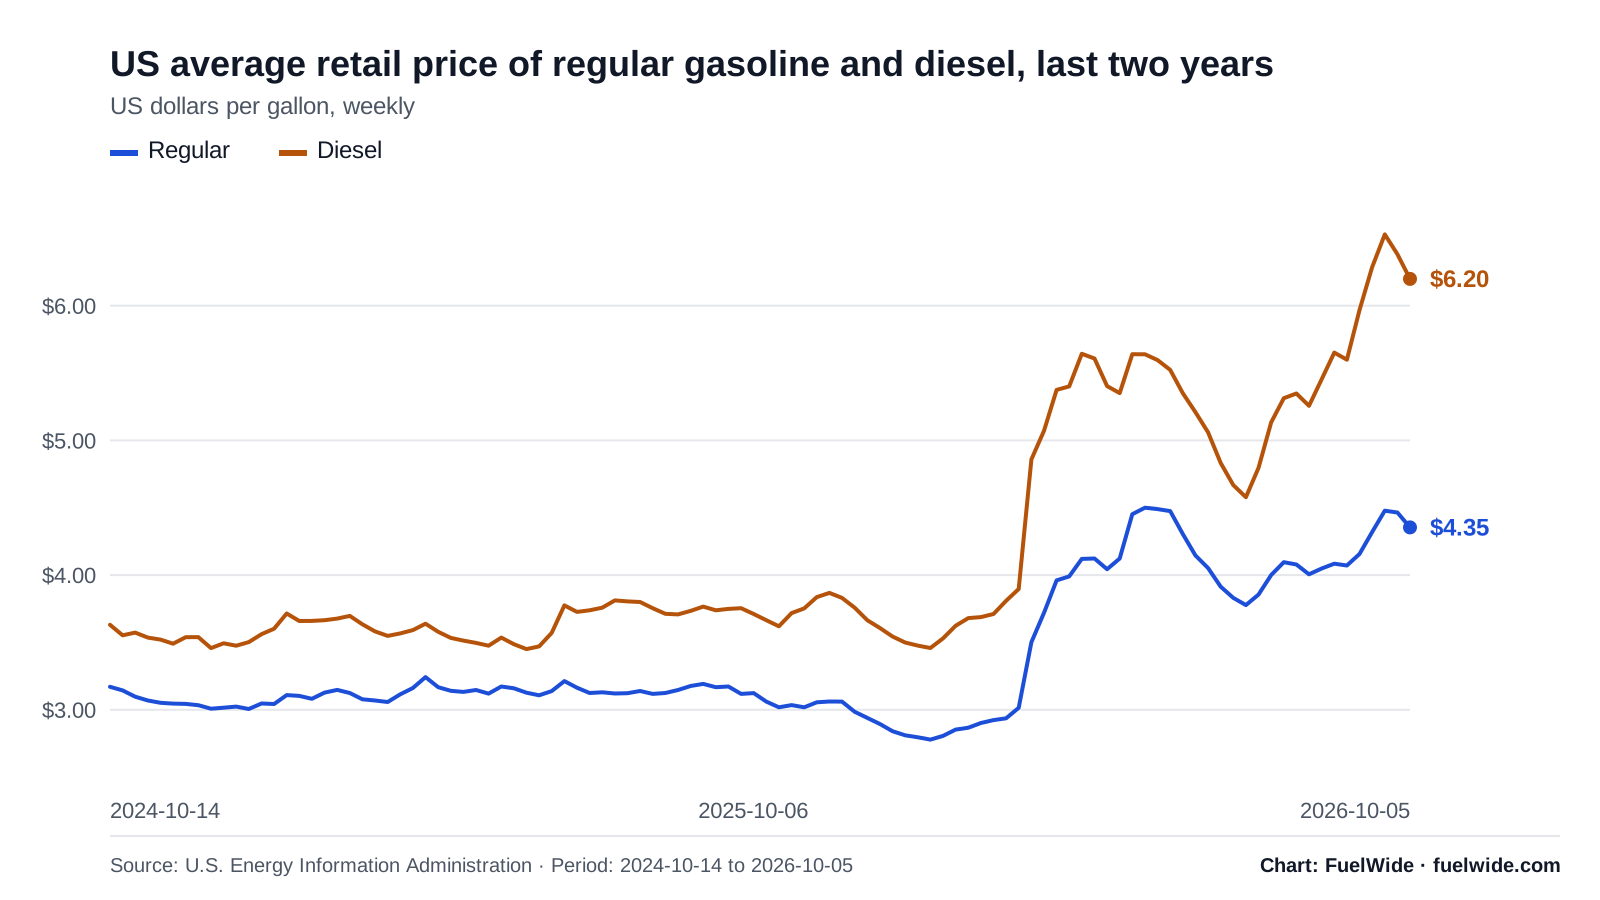
US average retail price of regular gasoline and diesel, last two years
US dollars per gallon, weekly · Source: U.S. Energy Information Administration
Alt text: Line chart of weekly US average retail prices over two years. In the week of 2026-10-05, regular gasoline was $4.35 and diesel $6.20 a gallon.
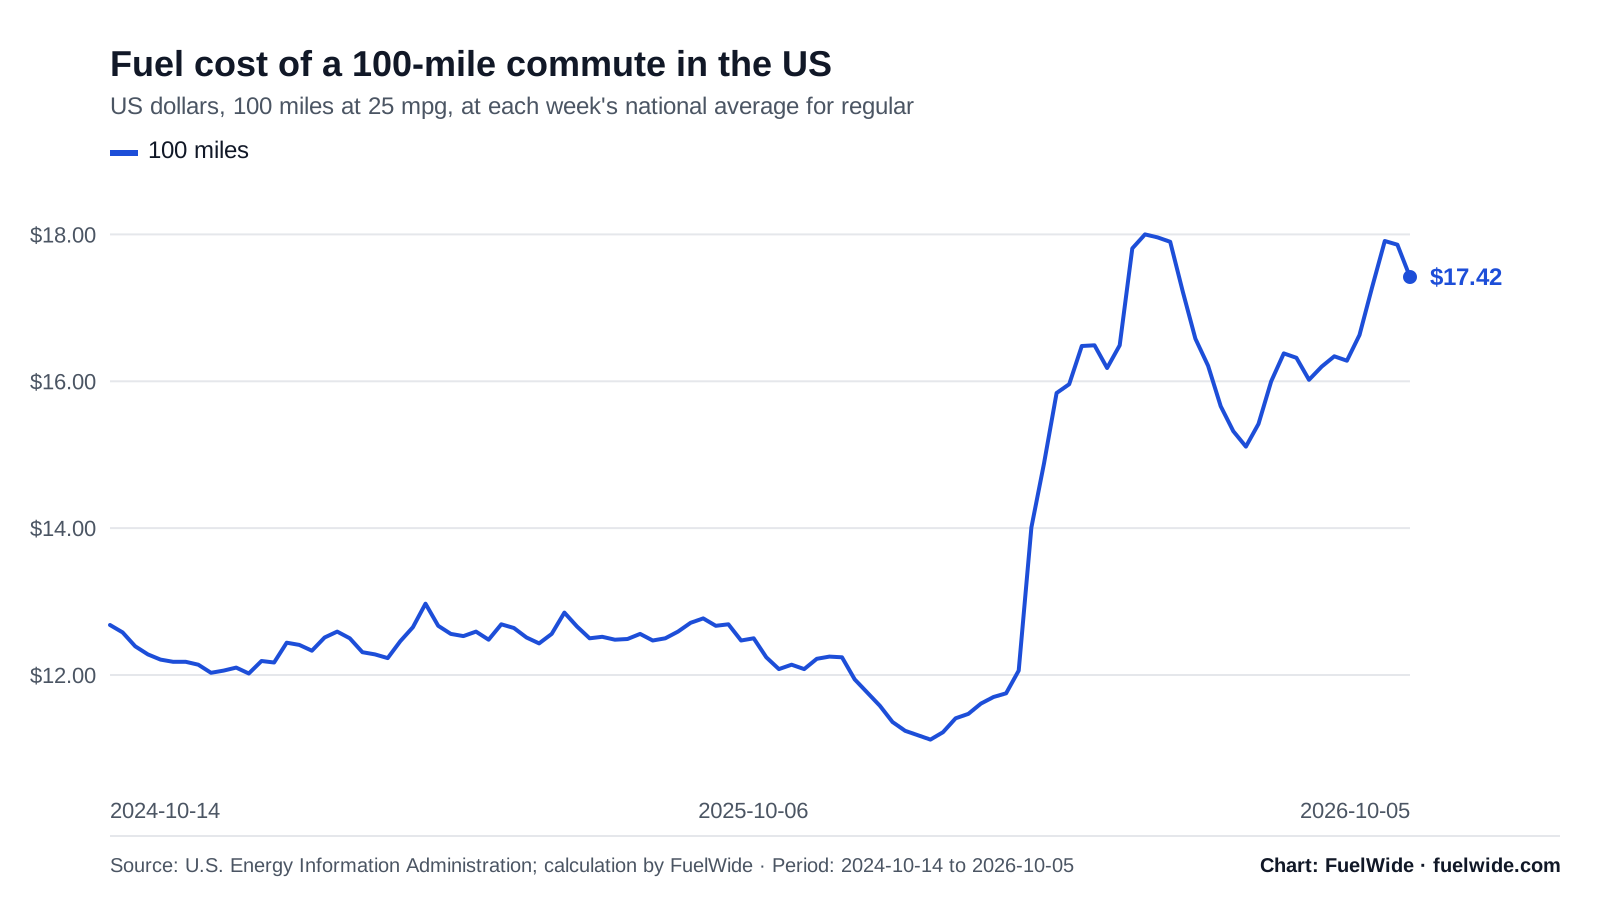
US dollars, 100 miles at 25 mpg, at each week's national average for regular · Source: U.S. Energy Information Administration; calculation by FuelWide
Alt text: Line chart of the weekly fuel cost of a 100-mile commute at 25 mpg. It was $12.68 in the week of 2024-10-14 and $17.42 in the week of 2026-10-05.
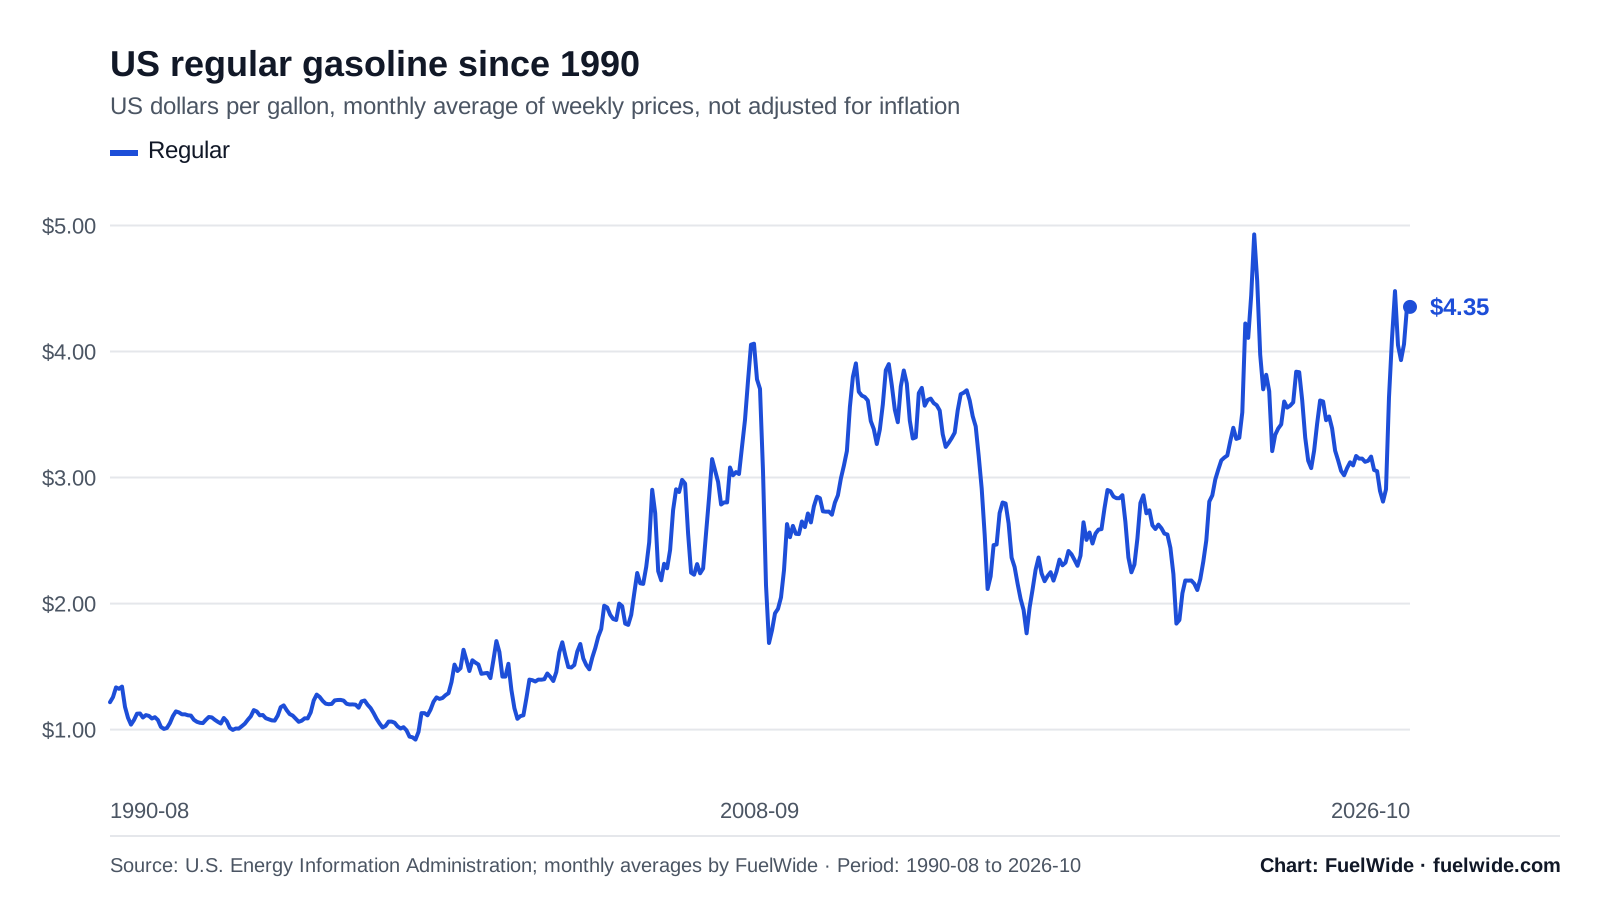
US dollars per gallon, monthly average of weekly prices, not adjusted for inflation · Source: U.S. Energy Information Administration; monthly averages by FuelWide
Alt text: Line chart of the monthly average US price of regular gasoline from 1990-08 to 2026-10, not adjusted for inflation; $4.35 a gallon in the latest month.
Twenty-one years of weekly pump prices — 1,087 weeks from 2005 for all 27 EU member states, petrol 95 and diesel, plus the Commission's consumption-weighted EU aggregate.
Thirty-six years of weekly US retail prices — 1,886 weeks from August 1990, national plus the nine states and ten metros the EIA surveys, all four grades.
Our own weekly archive — 14 snapshots from 2026-07-06 onward. It adds weekly snapshots of national markets the two long-run files above do not cover, such as the non-EU European markets. US states are not included. For EU member states and EIA-surveyed US areas, use those files: they go back decades rather than weeks.
All 31 sources with licence, review status and credit line.
Programmatic access: the free API and its OpenAPI spec. Station-level prices for 4 countries, 42,775 forecourts.
How to cite us
In text
Source: FuelWide (fuelwide.com)
Full reference
FuelWide, "Fuel prices by country", https://fuelwide.com/fuel-prices, accessed 2026-10-10.
A link to the page you took the figure from is appreciated and helps readers check it.
Put a live price card in your article
Two lines of HTML, no key, no account. The card updates itself, credits the publisher the figures came from, and links back to the page they are drawn from.
Europe here means the 42 European markets we track, which is the EU-27 plus the UK and 14 non-EU markets — not the EU-27 alone. The EU average above is the European Commission’s own volume-weighted EU-27 aggregate.
What the counts mean
Every coverage number on FuelWide uses these definitions, and the last column says how much of it you can download.
What each coverage count means, and how much of it is downloadable
Term
Count
What it means
In downloads & API
Markets
113
111 countries with a national average price, plus the USA and Canada (published from their own national datasets).
28 countries in countries.csv / the API; US figures via us-history.csv (EIA). Others are shown on the site but withheld from downloads pending licence review.
US states & DC
51
AAA daily state averages; 9 states also have the EIA weekly survey back to 1990.
EIA states only (us-history.csv, us-weekly.csv). AAA figures are quotable with credit but not redistributed.
US metro areas
467
AAA daily metro averages. Averages for an area, not a price at any one station.
Not in downloads (AAA).
Station prices
46,375
Forecourts in 6 countries whose own posted price comes from a national price-reporting feed.
42,775 station prices through the API, where the feed's licence allows.
Chain-priced stations
886
Bulgarian forecourts located from OpenStreetMap and priced at their chain's national list price — not a measurement of that pump.
Not in downloads pending review of the upstream terms.
FuelWide in one paragraph
FuelWide publishes retail fuel prices for 113 markets (111 countries plus the USA and Canada) and 46,375 station prices from national reporting feeds in 6 countries, plus 886 Bulgarian stations priced at their chain's national list price.Every figure carries the body that published it, the date it refers to, and how it was measured — a national average, a city median or a single forecourt’s own posted price. 39 of our 111 markets come from official government, regulator or open-data publications; the remaining 72 come from named commercial and aggregated sources. Every page states which one it is using.
What our data will and will not support
Good for
Cross-country comparison of pump prices in a single currency and unit
How much of a pump price is duty and VAT, where the publisher reports a pre-tax price
Forecourt-level price spread within a city, for the 7 countries with station feeds
Week-on-week movement in Europe and the US
Not good for
Intraday or real-time prices — our fastest national feed is daily and most are weekly
Long-run history outside the EU-27 and the EIA-surveyed US areas — our own archive for other markets has 14 weekly snapshots
Forecourt prices outside the countries listed on the sources page
Forecasting: we publish what prices are, never what they will be
Responsibility and corrections
Responsible for this data: Teodor Karagiozov, founder and editor. He built FuelWide and maintains its data pipeline, source registry and methodology, and answers corrections himself.
Tell us the page, the figure and what you believe is wrong — a link to your source helps.
We check it against the original publisher's data and our own calculation, and reply to you.
If we were wrong, we fix the figure and add a dated correction note to the page. We do not silently change published numbers.
If the upstream publisher was wrong, we say so on the page and link to their correction once it exists.
For a figure we do not publish, a cut of the data for a story, or a question about methodology, get in touch — we would rather spend twenty minutes making sure a number is right than see it misreported.
Logo: logo.png. Please use the wordmark as supplied and do not recolour it.
One important caveat
Most of what we publish is somebody else’s measurement. If you quote a price, credit the body that published it alongside us — their licence asks for that, and a FuelWide credit alone does not satisfy it. Each page names its own source, and the sources page lists the exact credit line for all 31.
If you quote something we calculated — a ranking, a median, a tax share, a Fair Price Score — credit Source: FuelWide (fuelwide.com) for the calculation and name the publisher of the prices it was calculated from. The calculation is ours; the underlying data keeps its own source and terms.